It was not possible to provide illustrations for the article on metric progress in Malaysia that was published on MV in January 2010. We can now remedy this deficiency.
Peninsula Malaya became independent of Britain in 1957. Malaysia, as we know it today, including Sarawak and Sabah but excluding Brunei and Singapore, came into existence in 1965. It began the changeover from Imperial to metric units in 1972, and the task was substantially complete within ten years.
Our article in January 2010, Metric progress in Malaysia, may inadvertently have given the impression that Malaysia has drifted into a measurement muddle similar to that which exists at present in the UK. This is definitely not so. On the street, Malaysia feels like a metric country just as much as, say, Australia or Spain, even if some of the usage is unfamiliar. We hope our photos illustrate this.
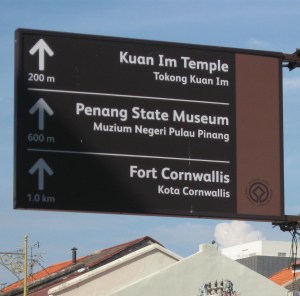
Firstly, some motorway signs:
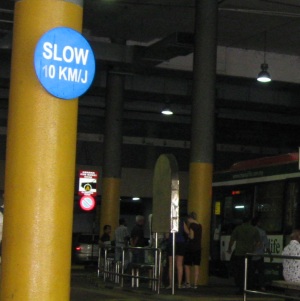
Three speed limit signs:
Two height restriction signs:
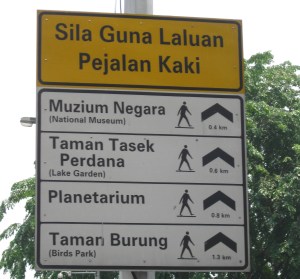
Three ‘official’ signs for pedestrians:
and some ‘private’ ones:
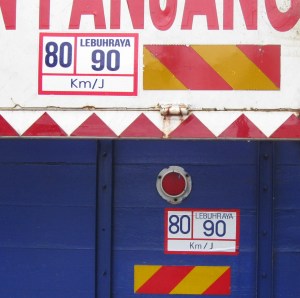
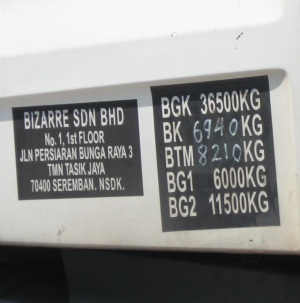
A few lorry markings:
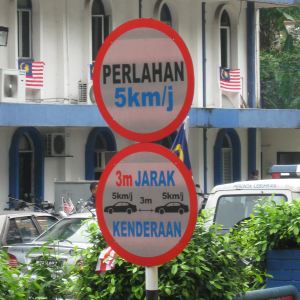
A curious pair of signs outside a police station, relating speed to gap between vehicles:
Private medicine sees a business opportunity:
And finally two reminders of times gone by:
Regular readers of MV will be able to find fault with many of the road signs illustrated. But it is worth asking if Britain is better served by its ‘perfect’ Imperial road traffic signs.









This is nothing to do with Malaysia but I thought I’d mention it anyway because it’s absurd: I just checked Google Maps to find out how my walk home from work in Australia compares to the walk home from work I used to take when I lived in London. The distances given in the walking directions for the Melbourne walk were in SI units but the London walk directions were in a mixture of decimal miles and feet! It seems that imperial units are the default setting for the UK and cannot be changed. I have no idea about decimal miles and after 22 years in Australia I’m pretty rusty on visualising feet. It’s ridiculous that I have to waste so much time converting each distance, and the level of accuracy diminishes with each conversion, to find out something as simple as walking directions.
LikeLike
These Google maps are even worse in my country, The Netherlands, a metric country. I have seen Google maps of Nijmegen and other Dutch locations with no scale at all and others with a scale on miles and feet taking pride of place, and a metric scale taking second place. If I want to use them, I have to choose the option ‘no scale’. The scale should at least give a choice between metric only or metric/non metric.
LikeLike
I would like to point out that miles, inches, and pounds are not traditional in Malaysia, and that many places in that country had no schools at all during the colonial period.
LikeLike
I use the Maps feature on my mobile phone as a sat nav and it works really well. The system uses Google Maps but is curious in that outside the UK the system uses metric only yet when I use it in he UK it is in miles and yards and cannot be changed. How odd, how annoying but what we have come to expect I guess.
LikeLike
In the US, Google Map scales are dual, miles and kilometers, switching to feet and meters for shorter distances. No yards. Also no option, it assigns the scale based on zoom level.
LikeLike
“But it is worth asking if Britain is better served by its ‘perfect’ Imperial road traffic signs.”
Readers may be interested in this data:
Malaysia (METRIC) 34.5 Road accidents death per 10,000 (RANK 20 in world)
UK (IMPERIAL) 4.8 Road accidents death per 10,000 (RANK 180 of 192 countries)
LikeLike
@RT
You are attributing a cause-and-effect relationship to something that may, or may not, have anything to do with how signs are marked. The fact is that drivers in Britain are quite well trained compared to other countries, while UK driving conditions demand a higher level of skill than those in other countries. These I suggest have a far higher influence on accident rates than whether the signs are metric or imperial.
As an example, the USA and Canada are adjacent countries, with very similar driving conditions. Yet Canada’s accident rate is considerably less than that of the USA, in spite of almost all of Canada enduring harsh winter driving conditions for much of the year, unlike much (though certainly not all) of the USA. Canada’s signs are metric – based on your logic, therefore, these metric signs are responsible for Canada’s lower accident rate. So we could reduce the UK’s accident rate even further if our roadsigns were converted to metric.
LikeLike
@John FL
You might look at this Wikipedia page ranking by three criteria, population, number of vehicles, and distance driven:
http://en.wikipedia.org/wiki/List_of_countries_by_traffic-related_death_rate
I think deaths per distance driven is the most proportional to the opportunity for risk. Figures by population or number of vehicles are subject to distortion. By this measure, Canada is only slightly better than the US. The UK has a VERY good figure, but Australia is comparable and Sweden and Switzerland superior (all metric). Note that UK and Switzerland rankings reverse if measured by population or distance driven.
I believe other factors are far more important than metric or non-metric signage.
In countries with “less behaved” drivers, the deaths per distance driven data is often missing. In that case I would rank by vehicles, not by population. Note how distorted China is by their huge population and low car ownership.
LikeLike
Picky I realise, but note the inconsistency in the abbreviation for kilometre: Km and km. You don’t get this in central control China.
km, is correct, obviously.
LikeLike
RT is misusing statistics to try and prove a point. If the UK is ranked at 180 out of 192, which countries are ranked 181 to 192? Which countries are ranked 175 to 179? Other factors that should be taken into account include condition of roads, national perception towards drink-drive, provisions for pedestrians, literacy and road-safety programs.
LikeLike
10 square kilometres, what`s that in square miles?
Gets um every time.
LikeLike